Many HR professionals who want to be more data-driven in their work ask the question “what is HR analytics?”. In this post, we explain what HR analytics is and how to get started with it.
What is HR analytics?
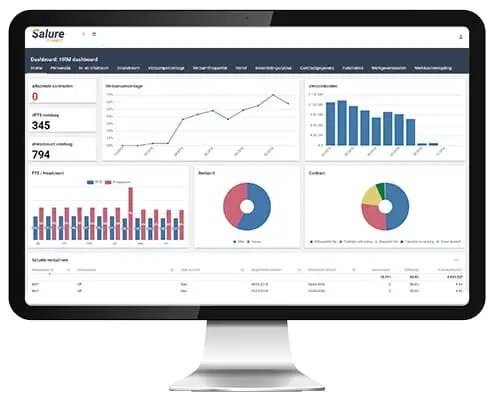
HR analytics, also known as workforce analysis or talent analysis, involves the collection, analysis and reporting of HR data. It enables your organisation to measure the impact of a range of HR statistics on overall business performance and make decisions based on data. In other words, HR analytics is a data-driven approach to Human Resources Management. You can read more about this in the HR dashboard.
HR analytics is actually a fairly new tool. This means that it is still largely unexplored in the scientific literature. The best-known scientific definition of HR analytics is that of Hill & Bondarouk. According to them, analytics in HR is the systematic identification and quantification of the drivers of business results.

Challenge: international management information
Especially for international HR, this type of management information offers great advantages. For example: a growing software company employs programmers in different countries. To decide which location to hire new staff in, management wants to compare the performance and costs of staff at the country level. Through international HRM dashboards, management can make a smart choice.
HR analytics thus enables strategic choices to be made at an international level. However, accessing the necessary management information can be a challenge. Differences in HR automation, working methods and laws and regulations, make it difficult to combine and compare data from different countries.
Why use HR analytics?
Analytics insights also enable HR managers to make informed decisions regarding the employee lifecycle, such as recruitment, training, performance evaluation, compensation or planning of training programmes
How do you use HR analytics successfully?
Want to use the dashboard for HR analytics successfully? Follow the step-by-step plan below!
Successfully use HR analytics in 8 steps
If you already use custom KPIs or want to introduce some, document them alongside standard HR metrics. Selecting indicators and metrics for HR systems with predictive capabilities is a task in itself. Machine learning models take into account problem properties, called characteristics, to predict outputs (future events or values).
To develop a model that can predict outcomes with the necessary accuracy, specialists need to select relevant features for training. So you have to evaluate the set of factors that can lead to a particular (positive or negative) future event you want to predict.
If you plan to consider data shared by candidates or current employees on social media sites, add these portals to your list. Also make sure you have the right to access and use individual-level data collected by external survey agencies.
The next consideration is whether to buy an off-the-shelf tool or build your own system. Well-known tools for HR analytics examples include Zoho People Plus, Gust and Namely. But the market also has a lot to offer in terms of AI-based solutions. IBM, for example, offers AI-powered talent management solutions for talent acquisition, development and assessment.
For example, you need a data analyst and scientist, as well as an HR manager and data engineer. A UX and UI designer are also needed to build your own software for HR analytics. The team structure depends on the complexity of the solution, the budget and the timeline. For instance, one specialist may have more responsibilities than we have described due to a limited budget.
At last, you drop off all those different goods at home. Without a car with a tank of petrol, money, a place to store items and knowing where to buy them, you would not be able to complete this task. So step five is about getting the infrastructure to extract data from different systems and send it to a single storage system for analysis and reporting.
The infrastructure for this task (especially the HR analytics system architecture) includes a data integration tool and a data warehouse.
If there is not enough data, they initiate additional data collection. After preparing data for machine learning, specialists start model training.
Model training is about providing an ML algorithm with historical training data with target attributes (correct answers to predict) or without. Data with mapped attributes (AKA labels) are used when you want to predict known attributes in new data, and this model training style is called supervised learning.
Choosing between static and dynamic (interactive) dashboards may be required for this purpose. The latter is updated with data and allows users to zoom in on data representation. In addition, it is a good idea to add an HR dashboard that can be shared.
In addition, make sure there is the ability to create ad-hoc reports. A feature that allows custom visuals to be placed is far from an unnecessary luxury.
Documentation written in plain language explaining key concepts and terms and screenshots, for example, would be useful for non-technical users. Video tutorials and interactive onboarding tools that instruct users on the go are also good complements to text resources.
It is not just about self-service tools and materials - a seminar-style group demonstration can also work.
The importance of an HR dashboard
As you might imagine, HR data analytics is of immense value to an organisation. These HR analytics examples are just the beginning. Analytics allow companies to, for instance, measure the business impact of human resource management. By applying complex statistical analysis, HR can predict the future of the workforce.
This allows managers to measure the financial impact of Human Resource practices. Measuring the impact of HR on business results is the ‘holy grail’ of HR data analysis. This is often done by calculating a Return on Investment (ROI). It is the most powerful way for HR to increase its strategic influence.

What does HR analytics measure?
Commonly used metrics within HR analytics are:
Turnover rate
Staff turnover is an important KPI and measure because high outflow can be very costly. Other possible KPIs regarding employee turnover are:
- Inflow: The number of employees entering the company.
- Advancement: The number of employees moving on internally.
Absenteeism
Absenteeism is a metric that can tell you a lot about employee satisfaction. Absenteeism gives you insight into productivity. When absenteeism is low, it can indicate satisfied employees, while high absenteeism may be due to pressure, dissatisfaction or other negative factors.
Leave
The leave metric gives you insight into all data of leave registration and administration. You can see the most up-to-date leave information at a glance.
Personnel costs
Calculating and listing (total) personnel costs (by country).
What percentage of the total salary consists of the basic salary, how much goes to allowance, bonus and social security. The personnel cost metric provides insight into this.
Training efficiency
Are you focused on training? Then it is nice to measure the results and determine whether the desired outcome has been achieved. Training efficiency can be measured by performing an analysis based on test scores and performance improvements.
Revenue per employee
Revenue per employee is a measure that can be used to measure the efficiency of the organisation as a whole.
The above metrics are some examples that can be included in HR analytics hrm dashboards.
Why HR analytics dashboards?
The success of an organisation is determined by the people who work there. Human resource analytics is important for understanding business data, assessing results and making data-driven decisions. HR analytics provides insight and recommendations based on HRM data. Given the scale of human resource costs within organisations, HR analytics is a discipline where a lot of gains can be made.
Detail level overview
Keep an overview of your entire workforce across multiple locations, including internationally. Our dashboards have handy search functions, such as zooming in to the detailed level of individuals. This gives you and other authorised employees a good overview of current data and reliable analyses.
Assessing result
Quickly see results of certain investments. For example, have you had some employees retrained and do you want to know the results? With SalureConnect, you create on overview of the data that provides the answer.
Whether it’s efficiency in sales, home care or cleaning, with SalureConnect you can easily make adjustments at the strategic level.
Data-driven decision-making
You can make decisions about your organisation’s human capital and structure based on data. Companies perform better when decisions are based on data-driven insights.


